https://lasma.eu/en/search/products
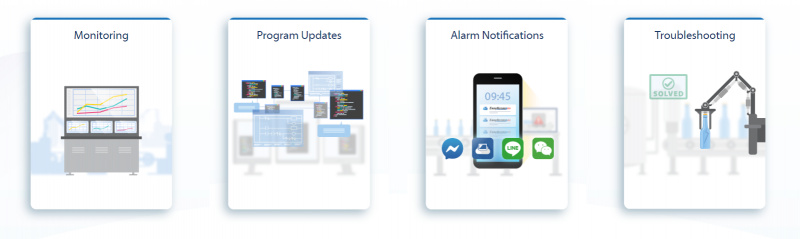
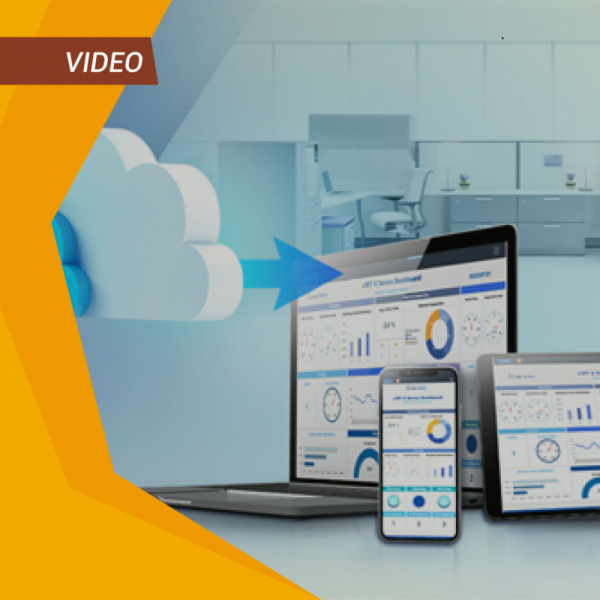
Who wouldn't like to see important information about the company's production processes on a laptop or on the screen of a human’s best friend – a smartphone. Or Even better, would be to see the running data and labor productivity of multiple plants on a single HMI visualization display. It's all possible! You can keep an eye on these things even as you maneuver through city's traffic. Collecting data and displaying information conveniently is half the battle. Currently, there are many different cloud services that collect data and further display it in an eye-pleasing form. However, all of them mostly require the involvement of IT specialists. This indicates that the process will be complicated and difficult to do on your own. Weintek offers a convincing solution to this inconvenience – quick HMI Dashborad creation without coding
Tabele of content:
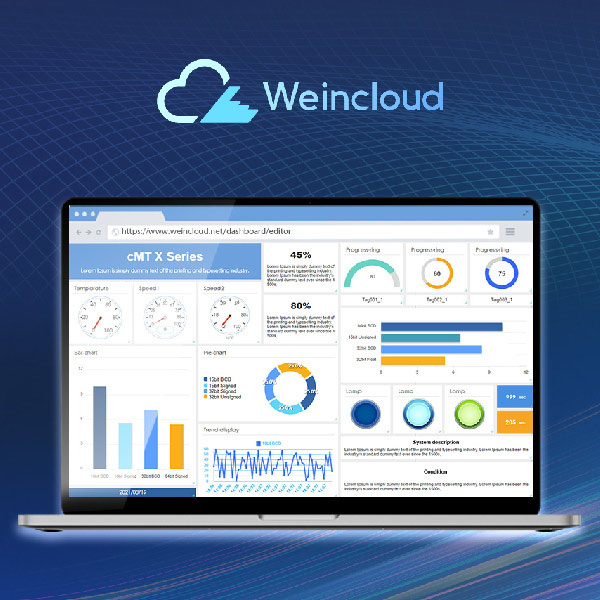
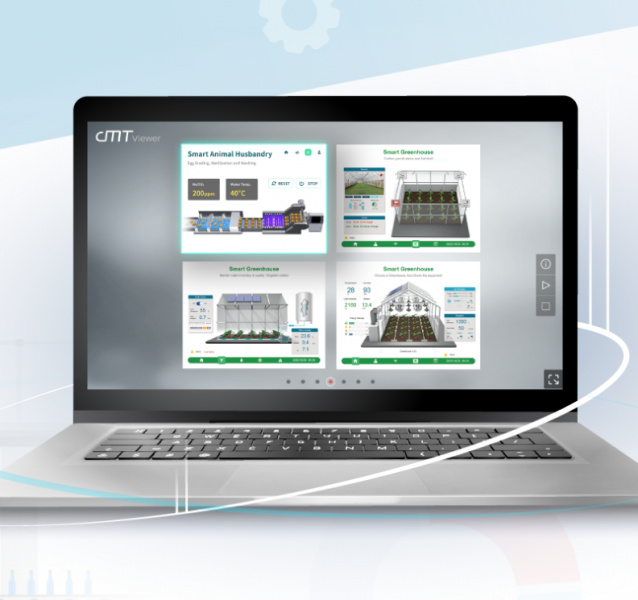
 So what exactly is DASHBOARD? This is a very easy question, the answer to which is as follows. As we mentioned earlier, the Taiwanese company Weintek, which is considered a leader in the development of HMI displays, has created a convincing solution for data collection and visualization. Dashboard is a cloud platform developed by Weintek, Weincloud or Weintek Cloud Service in its full name. It is a tool that allows you to create data visualization without writing code and without requiring specific knowledge in the IT sphere.
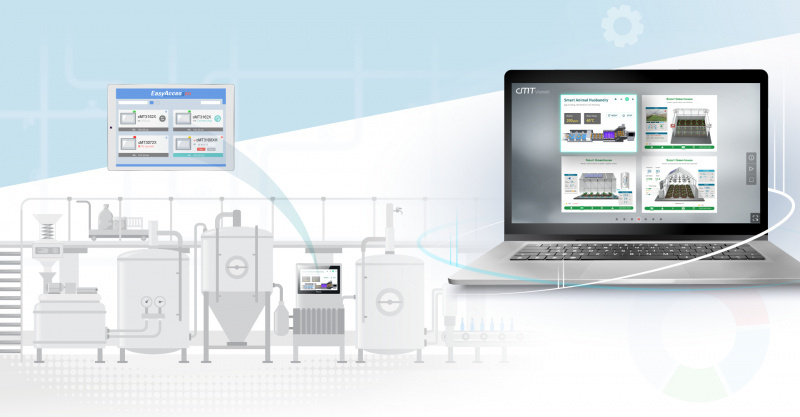
It should be mentioned that the intuitive DRAG and DROP development principle allows you to easily create the ideal project visualization. This means that data from multiple Weintek cMT-X visualization panels can be displayed on a single screen using Dashbord DRAG and DROP Widgets. They can even be located in different countries, not to mention those that are in the same factory. Dashboard display does not require special software. In other words, the most common Internet browser will cope with everything perfectly
Weincloud visualization includes several functions that allow you to create data display and accumulation processes. It is possible to remotely see data from multiple facilities, factories and even countries on one screen. It helps companies to create wider data monitoring and see the development overview of the most important processes in real time.

In addition, the Dashboard allows you to collect data and history view for up to one year. Thus, it helps companies to quickly compare and analyze data across multiple facilities and factories. With Dashboard, global data comparison and monitoring is now just one click away for everyone.
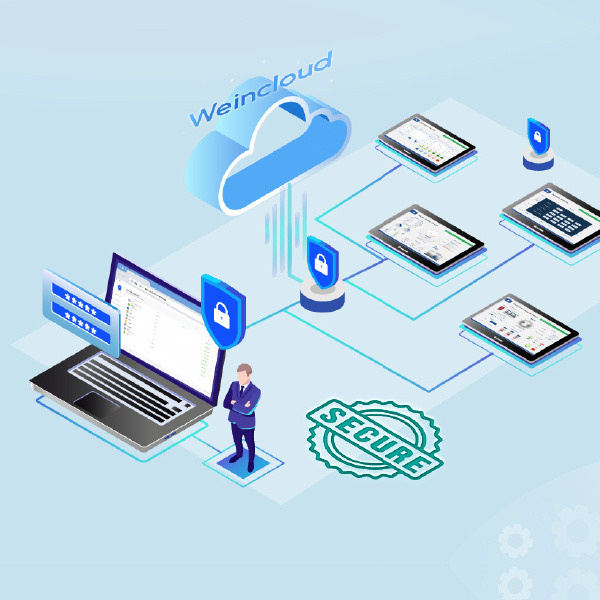
 Data security is an important aspect of any data processing and storage. This is even more important in cloud platforms. In this environment, data security risks are even more possible that are beyond our control. Both technical security and programming security are important at this point. On the technical side, physical server reliability, stability and, of course, data backup are essential
On the other hand, on the programming side, it is essential to ensure the safety of data during its travel from the device to the server, from the server to the screen. Weintek does not take shortcuts in this regard, but follows the path that is the safest for the user or consumer.
Technically, Weincloud uses Amazon's server base for its platform. This means that data security and data backup are reliable at the highest level. Everything related to programming data security for the Weincloud platform and data movement between the Weintek HM panel, the cloud service and the data viewer is encrypted with SSL/TLS. In addition, the Weincloud platform has successfully passed an independent security audit according to ISECOM OSSTMM and OWASP Testing Guide 4.0. Weintek takes data security very seriously.
| Strenghts | Weaknesses |
|
+ Easy DRAG and DROP visualization development that does not require advanced IT and programming skills |
- Only supports the new cMT-X series HMI |
| + No need for additional devices such as servers or Gateway devices | - Only Weintek's integrated range of Widgets is available |
| Mounting of additional devices and physical integration into the existing architecture is not necessary | - Limited number of pages for one visualization project (max. 10 pages) |
| + There is no need to develop a Cloud platform or Web SCADA system yourself |
In conclusion, we would like to say that Weintek provides its customers with a wide and convenient range of monitoring solutions. It definitely helps companies solve faster data management. We really hope that the article was useful to you and that you will be able to create your own data visualization with Weintek Dashboard without the help of coding!